Pythonの練習2−2
前回はmatplotlibでsin関数とcos関数を描画した.
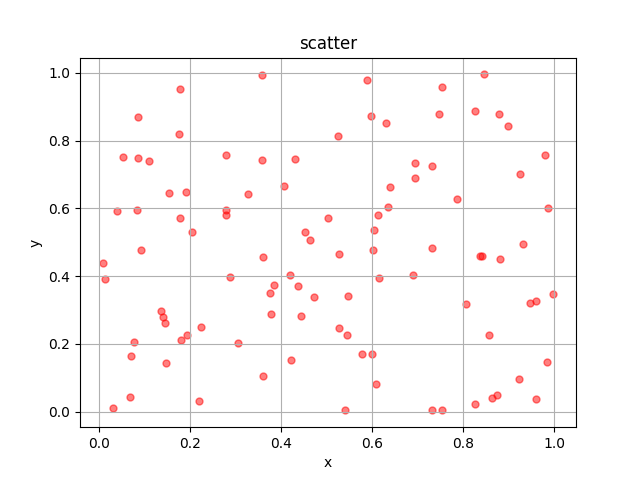
この記事では,同じくmatplotlibを使って散布図を作成する
コードは以下の通り
import matplotlib.pyplot as plt import numpy as np
x = np.random.rand(100)y = np.random.rand(100)

#散布図を描画plt.scatter(x,y,s=100,c="red",marker=".",alpha=0.5,linewidth='1')

#title
plt.title('scatter')

#label
plt.xlabel('x')plt.ylabel('y')

#grid
plt.grid()

#plt.show()

plt.savefig('./fig/sanpu.png')

plt.scatterの引数として,sはシンボルのサイズ,cは色,markerはシンボルの図形,alphaは透明度を意味している